Through the analysis of DNA traces in the droppings of a Leisler’s bat colony, researchers at LIB have now identified over 350 different insect species that were consumed by the bats.
Adequate food supply is a fundamental need and requirement for survival. To protect a species, it is often very helpful to know what that species prefers and frequently consumes. Through the analysis of DNA traces in the droppings of a Leisler’s bat colony, researchers at LIB (Leibniz Institute for the Analysis of Biodiversity Change) have now identified an astonishingly high number —over 350— different insect species that were consumed by the bats.
Especially for small animal species and those that are nocturnal, it can be extremely difficult to determine what they feed on. Identifying small prey insects or their remains is also rarely possible down to the exact species or family. In the case of the studied bat species, there is the additional challenge that it is a forest bat species that needs to be located first. “Following bats equipped with radio transmitters in the forest at night is quite special,” says Martin Koch, co-initiator of the study.
Design and installation of the guano trap (3 m) and roost entrance (9 m).
Fortunately — but also complicating matters — there are about 13 different bat species living in the investigated area near Bonn, in the forests of the Natura 2000 area ‘Waldreservat Kottenforst.’ Initially, as part of an EU Life+ project, roosts — the trees where the bats live — of the Leisler’s bats were identified, from which the study’s starting material was then obtained. This was done using a specially developed “guano trap.” The trap consists of approximately 2.2 square meters of mosquito netting stretched rectangularly.
It was installed about 3 meters high on the tree trunk, below the entrance to the roosting cavity at about 9 meters high. During the so-called “twilight swarming” after the nightly insect hunt, the bats return to the roosting cavity and initially circle the tree. They frequently perch briefly next to the cavity entrance and stick a small guano pellet to the trunk. Regularly, pellets fall and land in the mosquito netting under the cavity entrance. This “bat guano” was collected, fixed, and further processed in the laboratory.
“It’s fascinating how much DNA you can extract from a small amount of droppings and how much information we can draw from the DNA: from which bat species does the droppings come, and what has the bat eaten?” explains Dr. Kathrin Langen. Using the DNA contained in the droppings, our researchers were able to determine nine samples from nine different nights when only the target species swarmed around the roosting tree. On six other nights, other bats and a species of mouse were also active around the roosting tree. From the nine samples containing only the guano of the evening bat, an astonishingly rich menu was then reconstructed: the group consumed at least 126 different species of moths, 86 different species of flies and mosquitoes, 48 species of beetles, and a few dozen other various species of bugs, mayflies, caddisflies, and lacewings. Occasionally, spiders, harvestmen, lice, and other small animals were also consumed.
Timeline showing arthropod community composition at order level in the guano of N. leisleri, all three markers combined (COImldg, COIArt, 16S). With the exception of plots showing RRA assigned to major groups depending on sampling date (4C and 4F), read counts were not taken into account. A, D Number of species of each arthropod order detected at each time point; B, E Relative number of species per arthropod order as a percentage of the diet; C, F Species detected in each arthropod order, based on relative read abundances.
From the results, the team was able to deduce which of the three molecular genetic markers used worked best and provided the most species detections, a total of 358. “It’s incredibly satisfying to see what species lists come out at the end of all the lab work and bioinformatics,” says Dr. Sarah Bourlat, Head of the Metabarcoding Section at LIB, Bonn. However, the temporal course of the composition of the consumed insects was also interesting to observe: from late March to late June, the number of species in the guano steadily increases, only to decrease again by mid-August. This aligns very well with the activity patterns of certain insect groups.
The beech moth was the most frequently consumed butterfly, and a mayfly known as the transient virgin or ‘Uferaas’, was the most frequently consumed mayfly. The author team has listed the most important ecological parameters for the 18 key prey species in the study to contribute to better protecting the Leisler’s bat and the habitats needed by its prey insects.
Research article: Bourlat SJ, Koch M, Kirse A, Langen K, Espeland M, Giebner H, Decher J, Ssymank A, Fonseca VG (2023) Metabarcoding dietary analysis in the insectivorous bat Nyctalus leisleri and implications for conservation. Biodiversity Data Journal 11: e111146. https://doi.org/10.3897/BDJ.11.e111146
October and November 2023 were active months for the Pensoft team, who represented the publisher’s journals and projects at conferences in Europe, North America, South America, Oceania and Asia.
Let’s take a look back at all the events of the past two months.
The Biodiversity Information Standards Conference 2023
The annual gathering is a crucial platform for sharing insights, innovations, and knowledge related to biodiversity data standards and practices. Key figures from Pensoft took part in the event, presenting new ways to improve the management, accessibility, and usability of biodiversity data.
Prof. Lyubomir Penev, founder and Chief Executive Officer of Pensoft, gave two talks that highlighted the importance of data publishing. His presentation on “The Biodiversity Knowledge Hub (BKH): A Crosspoint and Knowledge Broker for FAIR and Linked Biodiversity Data” underscored the significance of FAIR (Findable, Accessible, Interoperable, and Reusable) data standards. BKH is the major output from the Horizon 2020 project BiCIKL (Biodiversity Community Integrated Knowledge Library) dedicated to linked and FAIR data in biodiversity, and coordinated by Pensoft.
Prof. Lyubomir Penev, Pensoft founder and CEO.
He also introduced the Nanopublications for Biodiversity workflow and format: a promising new tool developed by Knowledge Pixels and Pensoft to communicate key scientific statements in a way that is human-readable, machine-actionable, and in line with FAIR principles. Earlier this year, Biodiversity Data Journal integrated nanopublications into its workflow to allow authors to share their findings even more efficiently.
Chief Technology Officer of Pensoft Teodor Georgiev contributed to the conference by presenting “OpenBiodiv for Users: Applications and Approaches to Explore a Biodiversity Knowledge Graph.” His session highlighted the innovative approaches being taken to explore and leverage a biodiversity knowledge graph, showcasing the importance of technology in advancing biodiversity research.
Metabarcoding and Metagenomics editor-in-chief, Florian Leese.
The theme of the conference was “Monitoring Biodiversity for Action” and there was particular emphasis on the development of best practices and new technologies for biodiversity observations and monitoring to support transformative policy and conservation action.
Metabarcoding & Metagenomics’ editor-in-chief, Florian Leese, was one of the organisers of the “Standardized eDNA-Based Biodiversity Monitoring to Inform Environmental Stewardship Programs” session. Furthermore, the journal was represented at Pensoft’s exhibition booth, where conference participants were able to discuss metabarcoding and metagenomics research.
#geobonconf2023 was great as it linked different actors performing #biodiversity monitoring. Today we discussed #eDNA standardisation. We need formal standards, QA/QC, guidance, 🌐harmonisation to facilitate uptake. Cool to see our @DNAquaNet practical guide in this context. pic.twitter.com/eTOtr3yug8
Following the conference, Metabarcoding & Metagenomics announced a new special issue titled “Towards Standardized Molecular Biodiversity Monitoring.” The special issue is accepting submissions until 15th March 2024.
Asian Mycological Congress2023
The Asian Mycological Congress welcomed researchers from around the world to Busan, Republic of Korea, for an exploration of all things fungi from 10-13 October.
MycoKeys Best Talk award (winner not pictured).
Titled “Fungal World and Its Bioexploitation – in all areas of basic and applied mycology,” the conference covered a range of topics related to all theoretical and practical aspects of mycology. There was a particular emphasis on the development of mycology through various activities associated with mycological education, training, research, and service in countries and regions within Asia.
As one of the sponsors of the congress, Pensoft proudly presented a Best Talk award to Dr Sinang Hongsanan of Chiang Mai University, Thailand. The award entitles the winner to a free publication in Pensoft’s flagship mycology journal, MycoKeys.
Joint ESENIAS and DIAS Scientific Conference 2023
The ESENIAS and DIAS conference took place from 11-14 October and focused on “globalisation and invasive alien species in the Black Sea and Mediterranean regions.” Pensoft shared information on their NeoBiota journal and the important REST-COAST and B-Cubed projects.
Polina Nikova receiving the NeoBiota Best Talk Award.
Polina Nikova of the Bulgarian Academy of Sciences received the NeoBiota Best Talk Award for her presentation titled “First documented records in the wild of American mink (Neogale vision von Schreber, 1776) in Bulgaria.” The award entitles her to a free publication in the NeoBiota journal.
XII European Congress of Entomology
Pensoft took part in the XII European Congress of Entomology (ECE 2023) in Heraklion, Crete, from 16-20 October. The event provided a forum for entomologists from all over the world, bringing together over 900 scientists from 60 countries.
Carla Stoyanova, Teodor Metodiev and Boriana Ovcharova representing Pensoft.
The ECE 2023, organised by the Hellenic Entomological Society, addressed the pressing challenges facing entomology, including climate change, vector-borne diseases, biodiversity loss, and the need to sustainably feed a growing world population. The program featured symposia, lectures, poster sessions, and other types of activities aimed at fostering innovation in entomology. For Pensoft, they were a great opportunity to interact with scientists and share their commitment to advancing entomological research and addressing the critical challenges in the field.
🐝Today at #ECE2023, Prof Denis Michez & Sara Reverté are running a workshop on bee identification!
Throughout the event, conference participants could find Pensoft’s team at thir booth, and learn more about the scholarly publisher’s open-access journals in entomology. In addition, the Pensoft team presented the latest outcomes from the Horizon 2020 projects B-GOOD, Safeguard, and PoshBee, where the publisher takes care of science communication and dissemination as a partner.
Group photo of XIV International Congress of Orthopterology 2023 participants.
Hosted for the first time in Mexico, it attracted experts and enthusiasts from around the world. The congress featured plenary speakers who presented cutting-edge research and insights on various aspects of grasshoppers, crickets, and related insects.
Pensoft’s Journal of Orthoptera Research was represented by Tony Robillard, the editor-in-chief, who presented the latest developments of the journal to attendees.
Symposia, workshops, and meetings facilitated discussions on topics like climate change impacts, conservation, and management of Orthoptera. The event also included introductions to new digital and geospatial tools for Orthoptera research.
The 16th International Conference on Ecology and Management of Alien Plant Invasions
4th International ESP Latin America and Caribbean Conference
The 4th International ESP Latin America and Caribbean Conference (ESP LAC 2023) was held in La Serena, Chile, from 6-10 November. Focused on “Sharing knowledge about ecosystem services and natural capital to build a sustainable future,” the event attracted experts in ecosystem services, particularly from Latin America and the Caribbean.
🤩 So excited to be part of the 4th International ESP Latin America and Caribbean Conference, which opens later today! In a great tradition with the ESP conferences, we are offering three full APC waivers for the three best posters.@ESPartnershiphttps://t.co/O97nwEGnMj
Organised by the Ecosystem Services Partnership, this bi-annual conference was open to both ESP members and non-members, featuring a hybrid format in English and Spanish. Attendees enjoyed an excursion to La Serena’s historical center, adding a cultural dimension to the event.
The conference included diverse sessions and a special recognition by Pensoft’s One Ecosystem journal, which awarded full waivers for publication to the authors of the three best posters.
Magaly Aldave receiving the Best Poster Award.
Magaly Aldave of the Transdisciplinary Center for FES-Systemic Studies claimed first prize with “The voice of children in the conservation of the urban wetland and Ramsar Site Pantanos de Villa in Metropolitan Lima, Peru.” Ana Catalina Copier Guerrero and Gabriela Mallea-Rebolledo, both of the University of Chile, were awarded second and third prize respectively.
The event featured in-person and online participation, catering to a wide audience of researchers, academics, and students. It included workshops, presentations, and discussions, with a focus on enhancing understanding in biosystematics.
Pensoft awarded three student prizes at the event. Putter Tiatragu, Australian National University, received the Best Student Talk award and a free publication in any Pensoft journal for “A big burst of blindsnakes: Phylogenomics and historical biogeography of Australia’s most species-rich snake genus.”
Helen Armstrong, Murdoch University, received the Best Student Lightning Talk for “An enigmatic snapper parasite (Trematoda: Cryptogonimidae) found in an unexpected host.” Patricia Chan, University of Wisconsin-Madison, was the Best Student Lightning Talk runner-up for “Drivers of Diversity of Darwinia’s Common Scents and Inflorescences with Style: Phylogenomics, Pollination Biology, and Floral Chemical Ecology of Western Australian Darwinia (Myrtaceae).”
–
As we approach the end of 2023, Pensoft looks back on its most prolific and meaningful year of conferences and events. Thank you to everyone who contributed to or engaged with Pensoft’s open-access journals, and here’s to another year of attending events, rewarding important research, and connecting with the scientific community.
For the Pensoft team, September 2023 was a busy and exciting month filled with conferences. Travelling across Europe, they promoted journals, connected with the scientific community, and rewarded exceptional research with free article publications.
Let’s take a look back at all the events of the past month.
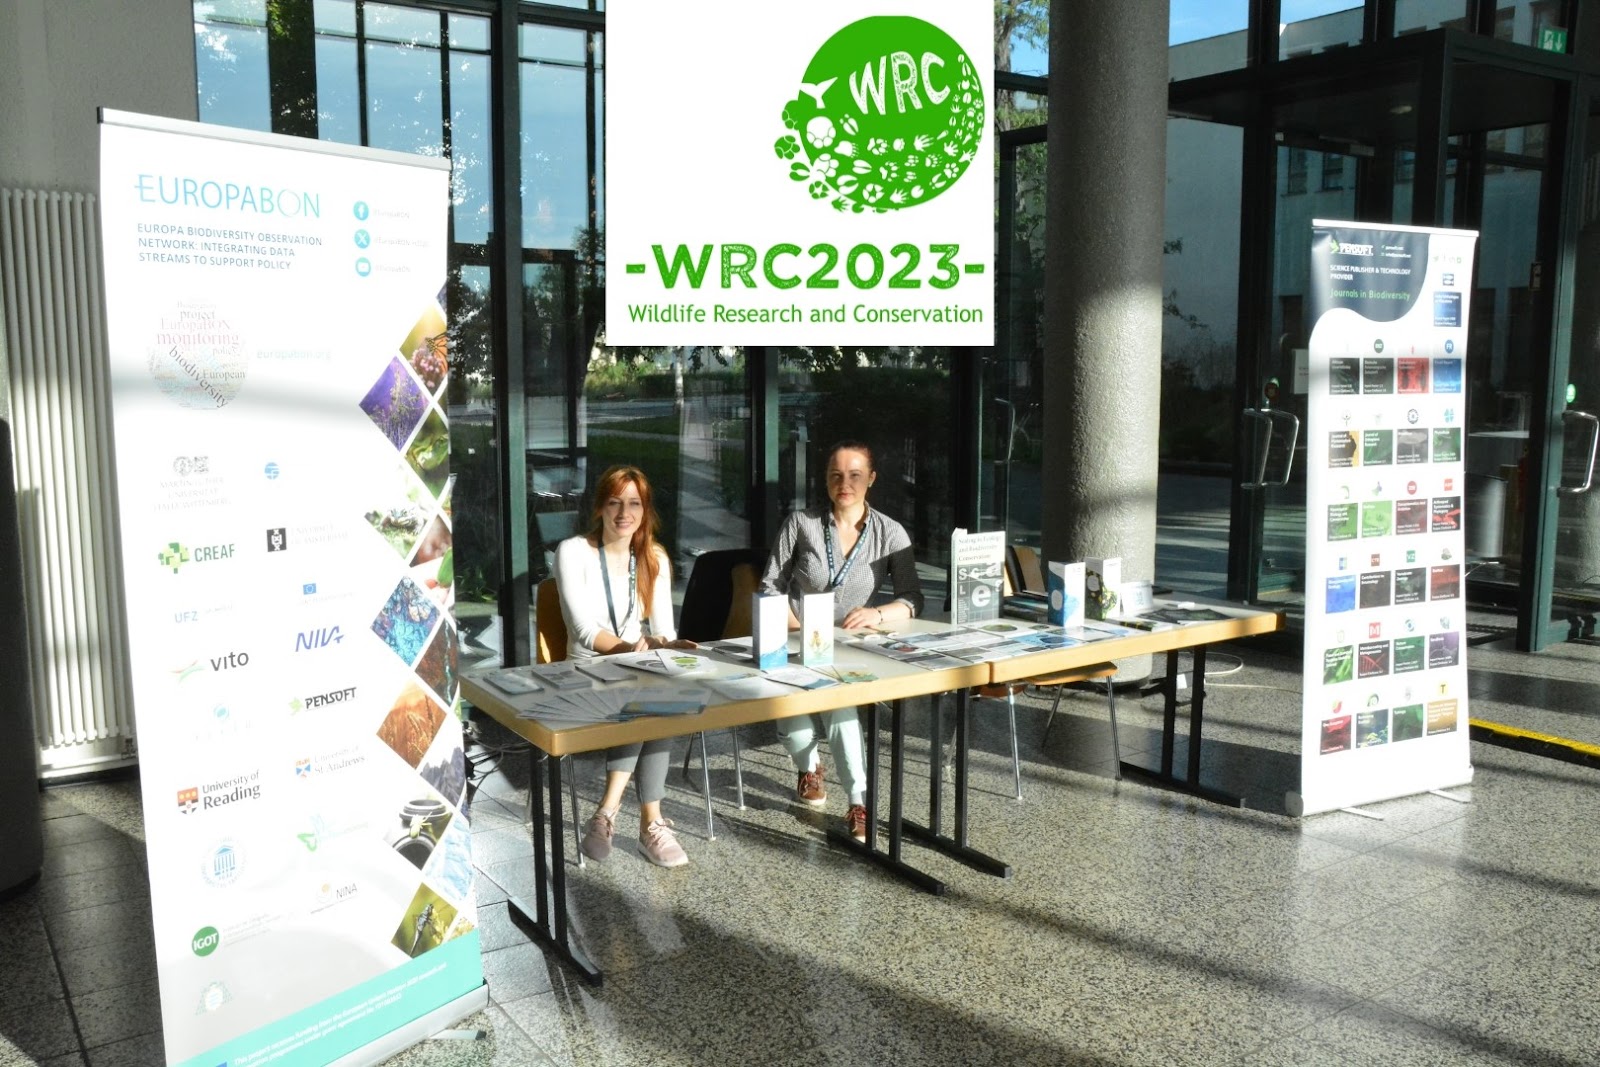
Pensoft representatives Mrs. Boriana Ovcharova and Mrs. Anna Sapundzhieva, ready to greet attendees in the sun.
The conference looked at evolutionary adaptations from the perspective of behavioural ecology, reproduction biology, genetics, physiology, as well as nature conservation. It particularly focused on the pressing issues of wildlife research and species conservation in the context of global environmental change. Most of the ≈100 participants were young scientists from more than 30 countries.
The Pensoft team greeted fellow attendees with an exhibition stand and presented the conservation and ecology-focused journals Neobiota, Nature Conservation, One Ecosystem, and Biodiversity Data Journal. Pensoft also advocated for EuropaBon, who are designing an EU-wide framework for monitoring biodiversity and ecosystem services, and REST-COAST, whose mission is to provide the tools to restore environmental degradation of rivers and coasts. Within both European-funded initiatives, Pensoft is a key dissemination partner that contributes expertise in science communication, scholarly publishing, and the development of digital tools and platforms.
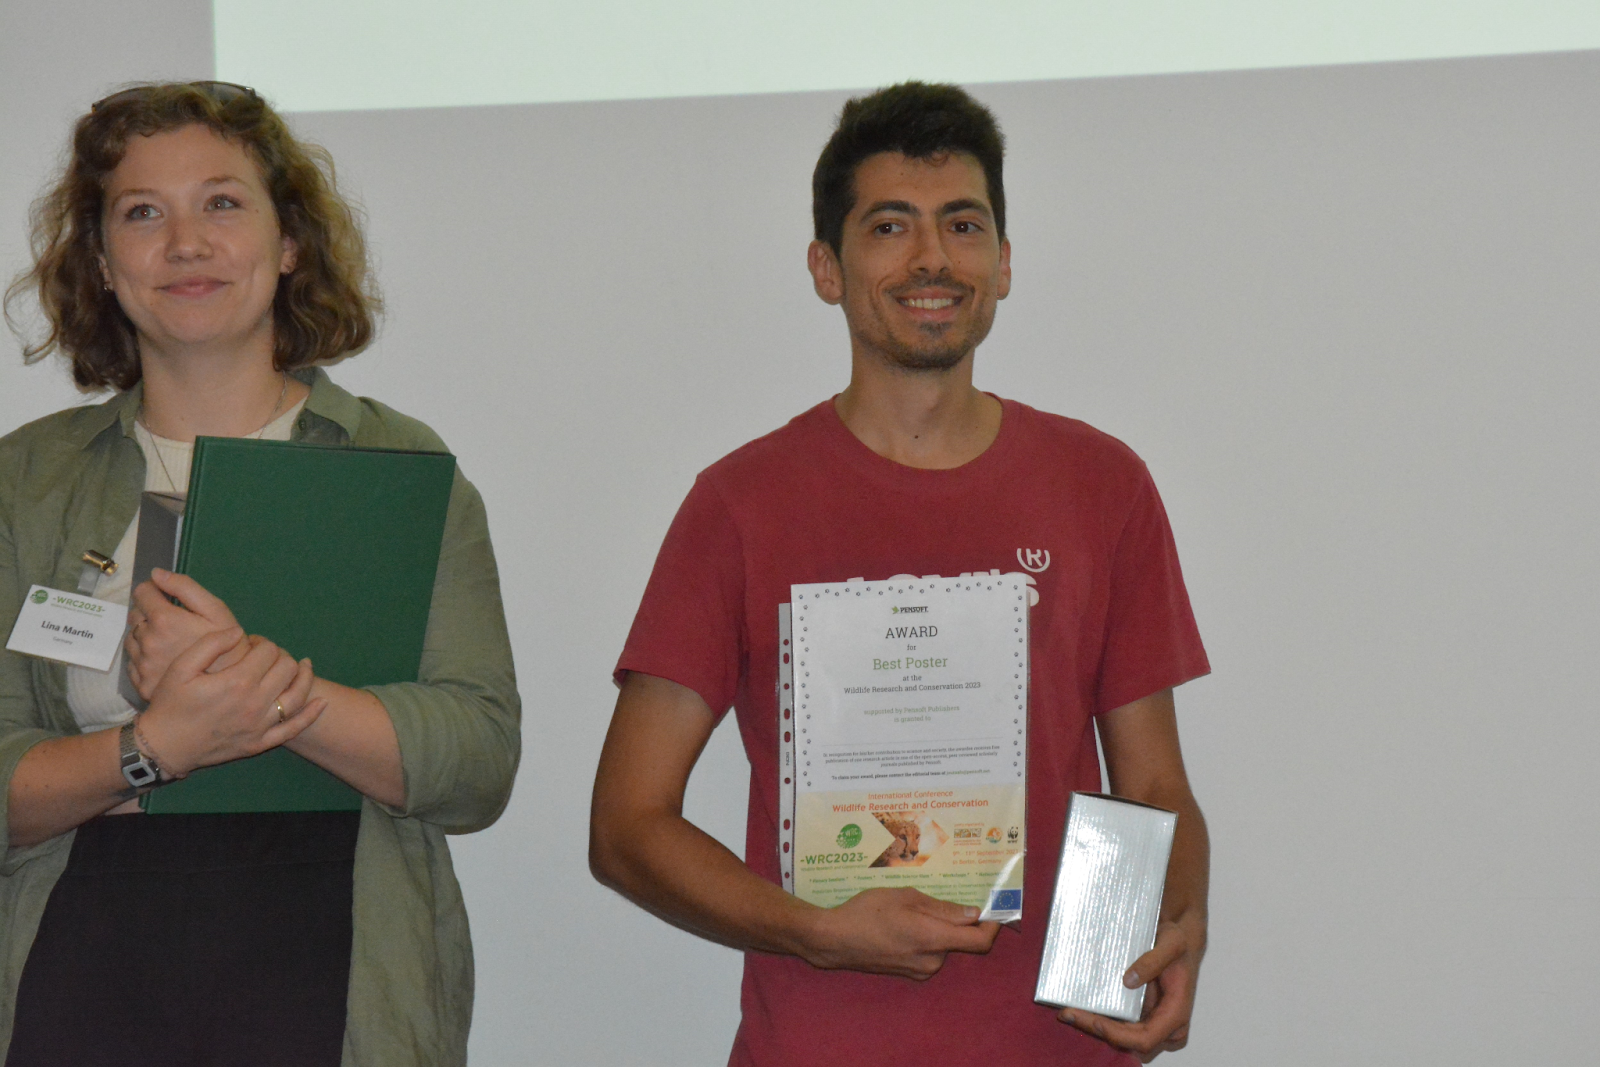
Joao Pedro Meireles posing with his Best Poster award.
Pensoft presented Joao Pedro Meireles from Utrecht University with the Best Poster Award for his research on pair compatibility in okapis, entitling him to a free publication in one of Pensoft’s open-access journals.
“My study looked at pair compatibility in the zoo breeding programme of Okapi. During breeding introductions, sometimes the male becomes aggressive towards the female and we decided to investigate the potential factors. We ran a survey among all zoos that house the species in Europe and we found that differences in husbandry were linked to the aggressiveness performed by the males.”
Joao Pedro Meireles, Utrecht University
GfÖ Annual Meeting 2023
From the 12th to 16th of September, the German Centre for Integrative Biodiversity Research hosted the 52nd Annual Meeting of the Ecological Society of Germany, Austria and Switzerlandin Leipzig, Germany. The meeting welcomed more than 1,100 participants from around the world, including scientists, policymakers, educators, and environmental enthusiasts.
This year’s meeting was held with the theme: “The future of biodiversity – overcoming barriers of taxa, realms and scales.” There was a particular emphasis on future challenges and opportunities facing biodiversity, and how to address and manage these in an interdisciplinary and integrative way.
Mrs. Boriana Ovcharova (Pensoft) with Neobiota Editor-in-Chief Prof. Dr. Ingolf Kühn.
Conference participants were welcomed at the Pensoft stand, where they could learn more about the projects EuropaBon and SELINA, which deal with biodiversity, ecosystem and natural capital topics.
Also in Leipzig, the European Conference on Ecological Modellingtook place between the 4th and 8th of September. The event focused on the transformation of how societies deal with natural resources in a world where biodiversity and ecosystem services are at high risk.
The ECEM 2023 continued a series of conferences launched by the European chapter of ISEM, the International Society for Ecological Modelling. ISEM promotes the international exchange of ideas, scientific results, and general knowledge in the areas of systems’ analysis and simulations in ecology, and the application of ecological modelling for natural resource management.
📢Shutout to all attending the #ECEM23@ECEM_2023#ecological#modelling conference TODAY in Leipzig! Make sure to visit the poster session during lunch & find about the unique article types welcome to our #journal! 💡They intend to disseminate models PRIOR TO implementation! https://t.co/dUVskYFK11
— Food & Ecological Systems Modelling Journal, FESMJ (@FESMJournal) September 5, 2023
The Bundesinstitut für Risikobewertung team presented a poster on the Formal Model format and potential new MiDox formats, unique publication types that can be submitted to Pensoft’s Food and Ecological Modelling Journal.
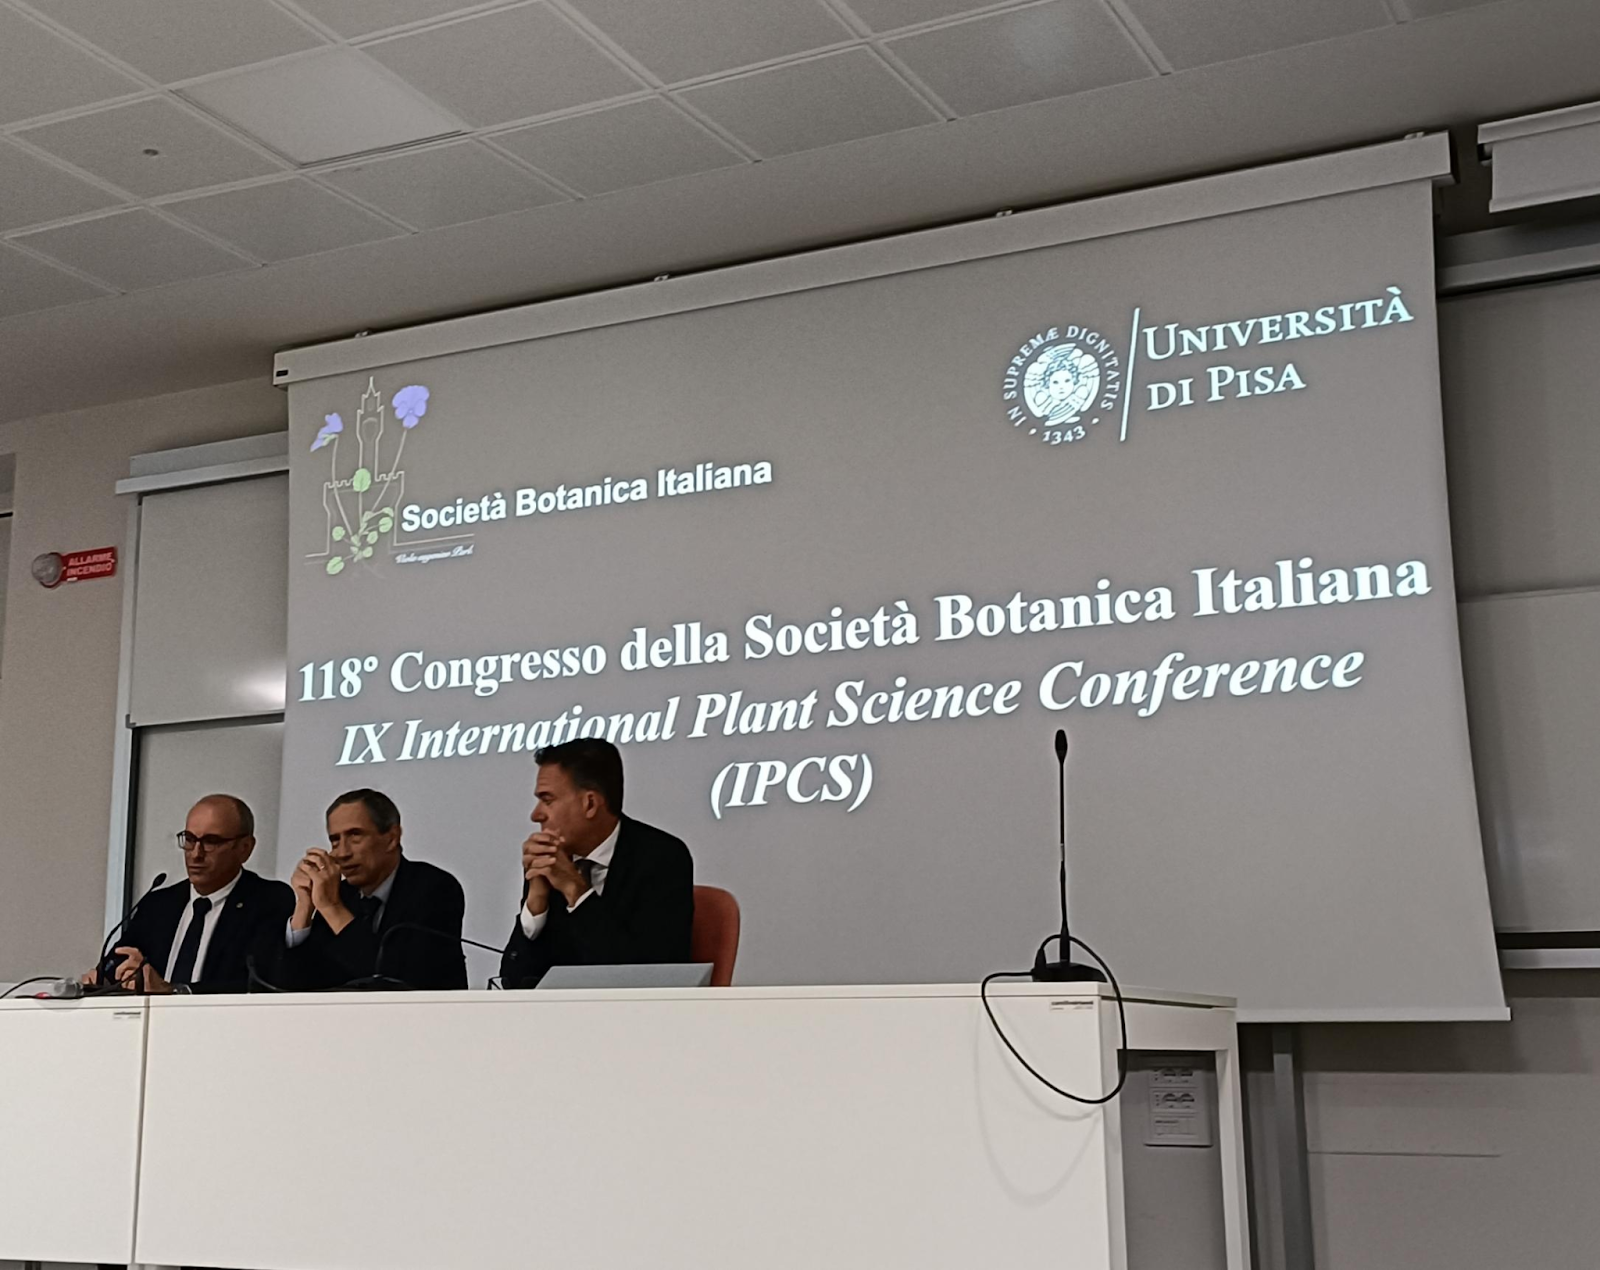
118th Congress of the Italian Botanical Society
Speakers at the 118th Congress of the Italian Botanical Society.
Pensoft was proud to sponsor the 118th Congress of the Italian Botanical Society, which took place in Pisa, Italy from the 13th to 16th of September. Experts in various fields of Botany gathered to share their research on the following topics:
Journals promoted by Pensoft at the 94th Annual Meeting of the Paläontologische Gesellschaft.
Summer may be well and truly over, but as a new academic year begins, Pensoft looks forward to attending more conferences, rewarding more incredible research, and connecting with more of the scientific community. Thank you to everyone who contributed to or engaged with Pensoft’s open-access journals this year, and here’s to a successful final quarter of 2023.
Today, 16 September 2023, we are celebrating our tenth anniversary: an important milestone that has prompted us to reflect on the incredible journey thatBiodiversity Data Journal (BDJ) has been through.
From the very beginning, our mission was clear: to revolutionise the way biodiversity data is shared, accessed, and harnessed. This journey has been one of innovation, collaboration, and a relentless commitment to making biodiversity data FAIR – Findable, Accessible, Interoperable, and Reusable.
Over the past 10 years, BDJ, under the auspices of our esteemed publisher Pensoft, has emerged as a trailblazing force in biodiversity science. Our open-access platform has empowered researchers from around the world to publish comprehensive papers that seamlessly blend text with morphological descriptions, occurrences, data tables, and more. This holistic approach has enriched the depth of research articles and contributed to the creation of an interconnected web of biodiversity information.
In addition, by utilising ARPHA Writing Tool and ARPHA Platform as our entirely online manuscript authoring and submission interface, we have simplified the integration of structured data and narrative, reinforcing our commitment to simplifying the research process.
One of our most significant achievements is democratising access to biodiversity data. By dismantling access barriers, we have catalysed the emergence of novel research directions, equipping scientists with the tools to combat critical global challenges such as biodiversity loss, habitat degradation, and climate fluctuations.
We firmly believe that data should be openly accessible to all, fostering collaboration and accelerating scientific discovery. By upholding the FAIR principles, we ensure that the datasets accompanying our articles are not only discoverable and accessible, but also easy to integrate and reusable across diverse fields.
As we reflect on the past decade, we are invigorated by the boundless prospects on the horizon. We will continue working on to steer the global research community towards a future where biodiversity data is open, accessible, and harnessed to tackle global challenges.
Ten years of biodiversity research
To celebrate our anniversary, we have curated some of our most interesting and memorable BDJ studies from the past decade.
Recently, news outlets were quick to cover a new species of ‘snug’ published in our journal.
“Life Beneath the Ice”, a short musical film about light and life beneath the Antarctic sea-ice by Dr. Emiliano Cimoli
We extend our heartfelt gratitude to our authors, reviewers, readers, and the entire biodiversity science community for being integral parts of this transformative journey. Together, we have redefined scientific communication, and we will continue to push the boundaries of knowledge.
Guest blog post by Cássio Cardoso Pereira, Daniel Negreiros, and Geraldo Wilson Fernandes
A recently published study by Pereira et al. in the prestigious journal Nature Conservation says that the solution for climate warming and environmental crises is not solely about curbing temperature by planting trees or even by changing our energy matrix. It is about changing our perspective on ourselves and the way we do things. There is a long list of things we have to do if we want to be successful. One important thing is changing policy actions.
This is a reflection of increased public attention to climate change at the expense of other biodiversity issues and may have contributed to a much higher number of UNFCCC Conferences of the Parties (COPs) linked to climate change (27 COPs) compared to those about biodiversity (15 COPs) to this date. Governments should not solely focus on curbing greenhouse gas emissions into the atmosphere. This asymmetry between environmental agendas can harm not only biodiversity, but also climate change, as environmental issues are inexorably interconnected.
Web search interest for environmental topics around the world from 2004 to the present according to Google TrendsTM. Comparison of intergovernmental bodies (A), conventions (B) and terms (C) related to climate (blue) and biodiversity (red). Values represent the percentage of maximum (peak popularity). IPCC: Intergovernmental Panel on Climate Change; IPBES: Intergovernmental Science-Policy Platform on Biodiversity and Ecosystem Services; UNFCCC: United Nations Framework Convention on Climate Change.
In a society with broad and deep environmental problems, government, private sector and non-governmental efforts should include other dimensions of nature in their agenda. Biodiversity, the unique variety of life on our planet, underpins our cultural, economic, and social well-being. The destruction of ecosystems undermines nature’s ability to regulate greenhouse gas emissions and protect us against extreme weather, thus accelerating climate change and increasing our vulnerability to it. Therefore, it is puzzling that policy-makers are still over-focused on the climate component.
We argue here that the climate change issue is important and urgent. However, this problem cannot be solved without considering the picture as a whole. In this way, changes in land use must be integrated into climate models so that we can achieve a more detailed representation that increases our ability to predict how local impacts of change in land use will affect the future of biodiversity at a global level.
We emphasise that this path is necessary, but it is still winding. There is much to pass on to society in terms of ecological awareness. The spotlight is on climate change, at least in part, because everyone already knows how to get involved in climate action in an accessible way. However, the degradation of biodiversity can be difficult to notice, especially for someone who does not get out and experience nature regularly. Therefore, a big question is how much we still have to learn about the various ecosystems across the planet, their delicate balance and interaction with their wider environment, and indeed the climate.
Reference:
Pereira CC, Negreiros D, Barbosa M, Goulart FF, Dias RL, Melillo MC, Camarota F, Pimenta MA, Cruz M, Fernandes GW (2023) Has climate change hijacked the environmental agenda? Nature Conservation 53: 157-164. https://doi.org/10.3897/natureconservation.53.110961
A new species of spiny mouse has been discovered in Ecuador, making it the 14th of its genus to be identified in the past five years. Neacomys marci, which was previously confused with another species, is around the length of a tennis ball, with a long tail, pale suede belly fur and a white throat.
Live specimen of new species Neacomys marci in its natural habitat. Photo by: Jorge Brito
Discovered in the Chocó biogeographic region in northwestern Ecuador, it is the 24th formally recognised species in its genus, which has seen significant upheaval in recent years.
Neacomys is a widely distributed genus of small spiny or bristly rodents that occupy habitats in eastern Panama and the northern half of South America. Since 2017, studies of the genus have been remarkably dynamic, resulting in the description of several new species.
Live specimen of new species Neacomys marci in its natural habitat. Photo by: Jorge Brito
However, as there are still many unexplored areas in South America and adjacent Central America (Panama), some of the currently recognised species have not been studied thoroughly, and the true diversity of the genus may be underestimated.
The Chocó biogeographic region is considered one of the most diverse biodiversity hotspots in South America, but one of the least studied despite its great size (along the Pacific coasts of Panama, Colombia and Ecuador). The rainforests of northwestern Ecuador have high biodiversity and endemism due to the influence of the Chocó and the Andes Mountains.
Habitat where specimens of Neacomys marci were collected in the study. Photo by: Jorge Brito
Major reviews of museum collections and increased field collection efforts have helped scientists understand Neacomys marci and other species. Molecular analysis is also being used to assist with more accurate animal group identification.
The new species was named after Marc Hoogeslag of Amsterdam, the Netherlands, who was co-founder and leader of the International Union for Conservation of Nature – Netherlands Land Acquisition Fund, which helps local groups around the world establish new ecological reserves and conserve endangered species. The EcoMinga Foundation‘s Manduriacu Reserve, home to this new species, is one of many reserves that have benefited from Hoogeslag’s program.
Original Source:
Tinoco N, Koch C, Colmenares-Pinzón JE, Castellanos FX, Brito J (2023) New species of the Spiny Mouse genus Neacomys (Cricetidae, Sigmodontinae) from northwestern Ecuador. ZooKeys 1175: 187-221. https://doi.org/10.3897/zookeys.1175.106113
Researchers recommend IUCN CPSG’s One Plan Approach to Conservation measures, which include both habitat conservation and increasing the number of threatened species in breeding stations and zoos.
Endangered psychedelic rock gecko (Cnemaspis psychedelica) Photo by Thomas Ziegler. Licence: CC-BY.
Further conservation measures are required to protect Vietnamese reptiles, such as the psychedelic rock gecko (Cnemaspis psychedelica), from habitat loss and overharvesting, concludes a new report, published in the open-access scientific journalNature Conservation.
Having identified areas of high reptile diversity and large numbers of endangered species, the study provides a list of the 50 most threatened species as a guide for further research and conservation action in Vietnam.
The study, based on the bachelor thesis of Lilli Stenger (University of Cologne, Germany), recommends IUCN CPSG’s One Plan Approach to Conservation measures, which, next to improved habitat conservation, also involves increasing the number of threatened species in breeding stations and zoos to maintain populations suitable for restocking.
“Modern zoos, as well as local facilities, can play a crucial role in not only conducting or financially supporting in situ conservation projects, that is to say in nature, but also by protecting species from extinction through maintaining ex situ assurance colonies to reinforce in situ conservation programs,”
said Prof. Dr. Thomas Ziegler, Vietnam conservation team member and coordinator from Cologne Zoo, Germany.
Endangered Truong Son pit viper or Quang Binh pit viper (Trimeresurus truongsonensis). Photo by Thomas Ziegler. Licence: CC-BY.
The scientists identified 484 reptile species known to Vietnam, aiming to provide a baseline to authorities, conservationists, rescue centers, and zoos, so they can follow up with appropriate conservation measures for endangered species. They note that the number is likely to go up, as the country is regarded as a top biodiversity hotspot, and the rate of new reptile species discoveries remains high.
According to the IUCN Red List, 74 of the identified species are considered threatened with extinction, including 34 endemic species. For more than half of Vietnam’s endemic reptiles (85 of 159), the IUCN Red List status is either missing or outdated, and further research is imperative for these species, the researchers say.
Vietnam has a high level of reptile diversity and an outstanding number of endemic species. The species richness maps in the study revealed the Central Annamites in central Vietnam to harbor the highest endemic species diversity (32 species), which highlights it as a site of particular importance for reptile conservation. Alarmingly, a protected area analysis showed that 53 of the 159 endemic species (33.2%) including 17 threatened species, have been recorded exclusively from unprotected areas, such as the Psychedelic Rock Gecko.
The Critically Endangered Annam pond turtle (Mauremys annamensis) is one of the most endangered turtle species in Vietnam and in the world. It is not known from any protected area. Despite likely being extinct in the wild, ex situ conservation programs have been implemented in time with a high number of individuals being kept and bred in zoos and stations and now ready for restocking actions. Photo by Thomas Ziegler. Licence: CC-BY.
In General, Vietnam is considered a country with high conservation priority due to habitat loss and overharvesting for trade, traditional medicine and food.
Globally, reptiles are considered a group of special conservation concern, as they play an important role in almost all ecosystems and often have relatively small distribution ranges, making them especially vulnerable to human threats.
***
Original source:
Stenger L, Große Hovest A, Nguyen TQ, Pham CT, Rauhaus A, Le MD, Rödder D, Ziegler T (2023) Assessment of the threat status of reptile species from Vietnam – Implementation of the One Plan Approach to Conservation. Nature Conservation 53: 183 221. https://doi.org/10.3897/natureconservation.53.106923
Guest blog post by Natalia Alvarado-Arias, Vinicio Moya-Almeida, Francisco Cabrera-Torres, and Andrea Medina-Enríquez
Urban rivers play a crucial role in providing ecosystem services that contribute to the social well-being and quality of life of urban inhabitants. However, rapid urbanization has led to the progressive degradation of these rivers, affecting their capacity to deliver these services and generating significant socioecological impacts. A groundbreaking study conducted in the Zamora and Malacatos Rivers in Loja, Ecuador, performed a participatory mapping of the non-monetary social values (both positive and negative) and their associated ecosystem services. This research, published in the journal One Ecosystem, aimed to understand community perceptions and preferences in the context of degraded landscapes, using a complementary analysis approach to traditional methods.
Oblique aerial photographs of the research area captured with unmanned aerial vehicles (2021). Left: Malacatos River. Right: Zamora River
The methodology employed in this study involved data collection and analysis using ArcGIS Survey123 Connect (ESRI 2020), a digital survey tool that facilitated easy data collection from participants. Additionally, The Social Values for Ecosystem Services (SolVES 4.0) tool was utilized, integrating participatory survey data and environmental data to assess and map the social values associated with ecosystem services. This combination of technological tools allowed for comprehensive analysis and visual representation of the results.
The study findings revealed that the most relevant social values encompassed learning, aesthetics, therapy, displeasure, deficient and inaccessible infrastructure, and the threat of flooding. Different spatial patterns were identified for each of these social values, with the horizontal distance to green areas emerging as a significant environmental variable contributing to these patterns.
Spatial distribution of positive social values.
These findings enhance our understanding of the social values and preferences associated with ecosystem services in urban river contexts. Furthermore, they provide valuable insights for identifying areas of opportunity and conflict, informing community planning, and enabling effective management of the urban landscape. The significance of this study lies in its novel approach, considering non-monetary social values, and its application in a city in the Global South, where previous research has predominantly focused on the Global North.
The degradation of urban rivers and the resulting socioecological impacts are a growing concern worldwide. Rivers play a vital role in providing natural resources, species habitats, freshwater supply, and flood control, while also satisfying the social, spiritual, and recreational needs of local communities. However, the processes of rapid urbanization have transformed river ecosystems into monofunctional channels and open sewers, negatively impacting the quality of life of residents.
Spatial distribution of negative social values.
This study emphasizes the importance of considering social values and community preferences when assessing and managing urban rivers. By doing so, opportunities and conflicts can be identified, and management strategies can be developed that are socially accepted and supported. Active community participation is crucial in this process as it allows for the addressing of traditional viewpoints and power asymmetries in planning.
The study employed a participatory and community-based approach, utilizing surveys and digital mapping tools such as ArcGIS Survey123 Connect (ESRI 2020) and The Social Values for Ecosystem Services (SolVES 4.0) to collect and analyze data from multiple social actors. This integration of technological tools and participatory methods allowed for a more comprehensive understanding of the social values and ecosystem services associated with urban rivers.
An urban river. Photo by alcides OTA used under a CC BY-NC 2.0 license.
In summary, this groundbreaking study highlights the importance of urban rivers as providers of ecosystem services and their role in the quality of life of urban communities. By understanding and valuing the social and cultural aspects of river ecosystems, effective management strategies can be developed to promote the restoration and conservation of these critical natural resources. Active community participation is essential in achieving sustainable management of urban rivers and ensuring a prosperous future for future generations.
Research article:
Alvarado-Arias N, Moya-Almeida V, Cabrera-Torres F, Medina-Enríquez A (2023) Evaluation and mapping of the positive and negative social values for the urban river ecosystem. One Ecosystem 8: e101122. https://doi.org/10.3897/oneeco.8.e101122
This happens more than you might think, with pet releases deemed responsible for 53% of invasive vertebrate species and one third of all aquatic invasive species. It has been shown that the more readily available a species is in the pet trade, the greater the risk of it being released, or escaping, into the wild.
Somewhat fascinatingly, this also puts the trade at the mercy of pop culture influences. 1970s animated series “Rascal the Raccoon” is commonly blamed for Japan’s invasive racoon population, and demand for Trachemys scripta pets is said to have boomed in the 1990s due to “Teenage Mutant Ninja Turtles.” Side note: the influence of movies highlighting the challenges of pet ownership, such as “Gremlins” or “Little Shop of Horrors”, warrants further study.
Hitchhikers
While invasion ecology has typically focused on these released species and the impacts that they cause, many species are sold with commensal organisms attached. These incidentally carried fauna are commonly known as “hitchhikers”.
Recent studies have found the protozoan Vorticella sp. and a species of bdelloid rotifer associated with two species of atyid shrimps, digenean larvae with the carnivorous snail Anentome helena, and an epibiont, Diceratocephala boschmai, on New Guinean ornamental Cherax crayfish.
Temnocephalid eggs located on thorax carapace (white arrow) of adult Cherax monticola. From Ložek F, Patoka J, Bláha M. 2021. Another hitchhiker exposed: Diceratocephala boschmai (Platyhelminthes: Temnocephalida) found associated with ornamental crayfish Cherax spp. Knowl. Manag. Aquat. Ecosyst., 422, 25.
A high-profile example emerged in 2021 when zebra mussels (Dreissena polymorpha) were detected in 21 US states on aquarium moss balls that had been imported from Ukraine, and subsequent searches revealed the species in 600 locations in Canada. Similar findings have since emerged from Europe. Having colonised both European and North American waters, the ease with which this Ponto-Caspian bivalve is being spread by the pet trade on both sides of the Atlantic is a major concern. Zebra mussels have been listed as one of the IUCN’s “100 of the Worst Invasive Species”, and their myriad ecological and economic impacts range from habitat alteration, to competition with native unionids, to disruption of food-web structure, to blocking industrial water intake pipes. They are also able to attach to boat hulls and other organisms, facilitating further spread.
The discovery
Zebra mussels, Dreissena polymorpha, found amongst ordered European pond snail, Viviparus viviparus
I remember the moment clearly. I had ordered seventy-five Viviparus viviparus – a common European pond snail species – for behavioural studies at GEOMAR Helmholtz Centre for Ocean Research Kiel where I was based for lab work in the group of Elizabeta Briski. After some stress over posting delays and an increasingly fraught relationship developing with the GEOMAR receptionist, the snails arrived. Over the next day, watching them go about their lives in our climate chamber in their new tanks became a favourite way to spend working breaks. With obvious dimorphism you could clearly tell males from females, which added to the developing snail soap operas. However, just before packing up to leave the lab, I noticed a huge lump on one snail. What on earth is that? Soon I noticed a second. I called Elizabeta with my suspicions, which she confirmed the next day. Photos were taken, measurements made, and our go-to ecological geneticist Reid Brennan was begged to work his DNA sequencing magic. Before long, it was all confirmed: we had zebra mussels.
Potential implications
The biggest takeaway message here is that even native species in the pet trade can facilitate the spread of non-native hitchhikers. In a parallel universe, those snails did not go to an invasion ecology lab but rather to someone keen to stock their garden pond. Escape from ponds is a major pathway for freshwater species introductions, and even if the impact of a native species escaping might be limited, its potential for the zoochorous dispersal of a non-native should not be ignored.
Zebra mussels, Dreissena polymorpha, found amongst ordered European pond snail, Viviparus viviparus.
Of course, questions surround the conditions under which the pond snails were held before selling. Were they stocked in zebra mussel infested outdoor ponds? Which other species are held in a similar way? How prevalent are these practices within the trade? One way of combating this risk of non-native species spread is via legislation. Calls have been made for white lists of low-risk species that can be sold in the trade in place of risky species, but in our study, the issue stems from the selling of a native species within its native range, which would surely be deemed low-risk.
We propose that should a white-list system be adopted, the potential for a “low-risk” species to transport invasive species must be accounted for. We also call for stricter biosecurity practices to be enforced, including regular checking and disinfecting of outdoor stock ponds where appropriate. Tools such as environmental DNA surveillance could be used to effectively detect the presence of targeted invasive species, as part of biosecurity “audits”. However, for the time being, a desperate, final line of defence is to raise awareness amongst consumers and for them to be wary of unwanted hitchhikers.
References:
Dickey JWE, Brennan RS, Chung SS, Jeschke JM, Steffen GT, Briski E (2023) More than we bargained for: Zebra mussels transported amongst European native freshwater snails. NeoBiota 10: 1–10. https://doi.org/10.3897/neobiota.83.97647
DeRoy EM, Scott R, Hussey NE, MacIsaac HJ (2020) Density dependence mediates the ecological impact of an invasive fish. Diversity and Distributions 26: 867–880. https://doi.org/10.1111/ddi.13063
Gippet JMW, Bertelsmeier C (2021) Invasiveness is linked to greater commercial success in the global pet trade. Proceedings of the National Academy of Science USA 118. https://doi.org/10.1073/pnas.2016337118
Lozek F, Patoka J, Bláha M (2021) Another hitchhiker exposed: Diceratocephala boschmai (Platyhelminthes: Temnocephalida) found associated with ornamental crayfish Cherax spp. Knowledge and Management of Aquatic Ecosystems 2020-Janua. https://doi.org/10.1051/kmae/2021023
Militz TA, Foale S (2017) The “Nemo Effect”: Perception and reality of Finding Nemo’s impact on marine aquarium fisheries. Fish and Fisheries 18: 596–606. https://doi.org/10.1111/faf.12202
Padilla DK, Williams SL (2004) Beyond ballast water: Aquarium and ornamental trades as sources of invasive species in aquatic ecosystems. Frontiers in Ecology and the Environment 2: 131–138. https://doi.org/10.1890/1540-9295(2004)002[0131:BBWAAO]2.0.CO;2
Patoka J, Patoková B (2021) Hitchhiking Exotic Clam: Dreissena polymorpha (Pallas, 1771) Transported via the Ornamental Plant Trade. Diversity 13: 1–5.
Patoka J, Magalhães ALB, Kouba A, Faulkes Z, Jerikho R, Vitule JRS (2018) Invasive aquatic pets: Failed policies increase risks of harmful invasions. Biodiversity and Conservation 27: 3037–3046. https://doi.org/10.1007/s10531-018-1581-3
Richardson MJ, Whoriskey FG, Roy LH (1995) Turbidity generation and biological impacts of an exotic fish Carassius auratus, introduced into shallow seasonally anoxic ponds. Journal of Fish Biology: 576–585.
Saul WC, Roy HE, Booy O, Carnevali L, Chen HJ, Genovesi P, Harrower CA, Hulme PE, Pagad S, Pergl J, Jeschke JM (2017) Assessing patterns in introduction pathways of alien species by linking major invasion data bases. Journal of Applied Ecology 54: 657–669. https://doi.org/10.1111/1365-2664.12819
Simberloff D (2006) Risk assessments, blacklists, and white lists for introduced species: Are predictions good enough to be useful? Agricultural and Resource Economics Review 35: 1–10. https://doi.org/10.1017/S1068280500010005
Stanicka A, Maciaszek R, Cichy A, Templin J, Świderek W, Żbikowska E, Labecka AM (2022) Unwanted ‘hitchhikers’ of ornamental snails: A case report of digeneans transported via the international pet trade. The European Zoological Journal 89: 601–607. https://doi.org/10.1080/24750263.2022.2065039
Zeng Y, Shakir KK, Yeo DCJ (2019) Competition between a native freshwater crab and an invasive crayfish in tropical Southeast Asia. Biological Invasions 21: 2653–2663. https://doi.org/10.1007/s10530-019-02009-6
“Not only does it mean that content is persistent in merit and quality, but that innovative research outputs are already appreciated within academia,” says Editor-in-Chief Prof Dr Benjamin Burkhard
Seven years after its official launch in May 2016, the One Ecosystem journal has successfully completed the rigorous quality and integrity assessment at Web of Science.
The news means that One Ecosystem might see its very first Journal Impact Factor (JIF) as early as 2024, following the latest revision of the metric’s policies Clarivate announced last July. According to the update, all journals from the Web of Science Core Collection are now featured in the Journal Citation Reports, and thereby eligible for a JIF.
“Giving all quality journals a Journal Impact Factor will provide full transparency to articles and citations that have contributed to impact, and therefore will help them demonstrate their value to the research community. This decision is aligned to our position that publications in all quality journals, not just highly cited journals, should be eligible for inclusion in research assessment exercises,” said back then Dr Nandita Quaderi, Editor-in-Chief and Editorial Vice President at Web of Science.
“We are happy to learn that Web of Science has recognised the value and integrity of One Ecosystem in the scholarly landscape. Not only does it mean that the scientific content One Ecosystem has been publishing over the years is persistent in merit and quality, but that innovative research outputs are already widely accepted and appreciated within academia.
After all, one of the reasons why we launched One Ecosystem and why it has grown to be particularly distinguished in the field of ecology and sustainability is that it provides a scholarly publication venue for traditional research papers, as well as ‘unconventional’ scientific contributions,”
“These ‘unconventional’ research outputs – like software descriptions, ecosystem inventories, ecosystem service mappings and monitoring schema – do not normally see the light of day, let alone the formal publication and efficient visibility. We believe that these outputs can be very useful to researchers, as well as practitioners and public bodies in charge of, for example, setting up indicator frameworks for environmental reporting,”
“In fact, last year, we also launched a new article type: the Ecosystem Accounting table, which follows the standards set by the the System of Environmental-Economic Accounting Ecosystem Accounting (SEEA EA). This publication type provides scientists and statisticians with a platform to publish newly compiled accounting tables,”
Previously, One Ecosystem has been accepted for indexing at over 60 major academic databases, including Scopus, DOAJ, Cabell’s Directory, CABI and ERIH PLUS. In June 2022, the journal received a Scopus CiteScore reading 7.0, which placed it in Q1 in five categories: Earth and Planetary Sciences; Ecology; Nature and Landscape Conservation; Agricultural and Biological Sciences (miscellaneous); Ecology, Evolution, Behavior and Systematics.